Injury Pyramid of Japan
1. How Injured do Japanese People Get?
Just how injured do Japanese people get throughout the course of a year? Also, what is the breakdown of the causes and severity of these injuries? Despite the relative simplicity of these questions, they are not easy to answer.
The answers to these questions can be found in the Patient Survey conducted by Japan’s Ministry of Health, Labour and Welfare. This survey, which is conducted once every three years, aims to “investigate the actual situation of diseases and injuries of the patients who use hospitals and clinics (hereafter, medical institutions) to obtain basic data for the promotion of medical and health services”. At the point of writing this manual (March 2016), the most recent Patient Survey was conducted in 2014, with previous surveys conducted in 2011, 2008, 2005, 2002, 1999, and so on.
There are more than 13,000 hospitals and XXX clinics located throughout Japan, but only approximately XX% are included in the survey. In the 2011 survey, all 6,428 hospitals and 5,738 clinics (corresponding to XX% of all clinics; excluding dental clinics) were included in analysis. All of the medical institutions surveyed would record and report on the numbers of inpatients and outpatients, as well as the medical care provided to these patients on a specified date in October of the survey year.
Details on injuries are examined based on the World Health Organization’s International Classification of Diseases and Related Health Problems (ICD). Information on injuries is provided in Chapter XIX of this classification system entitled “Injury, poisoning and certain other consequences of external causes”. These include injuries due to traffic accidents, occupational accidents, and accidents that occur at home or at school.
According to the 2011 Patient Survey, an estimated 124,800 inpatients and 317,600 outpatients were treated at hospitals and clinics. Both of these estimates were obtained from a single day. The Patient Survey also provides estimates on the total number of patients by calculating the “estimated number of patients who were continuously receiving medical treatment (including those who did not receive medical treatment at medical institutions on the dates of this survey)” as follows:
Estimated number of inpatients + Estimated number of initial-visit outpatients + [Estimated number of return-visit outpatients × Average interval since last visit × Adjustment factor (6/7)]
This estimation formula (especially the third component) may be slightly difficult to understand, and is explained further for clarity below. Although outpatients generally make multiple visits to medical institutions, let us assume an average interval of one month (30 days) between outpatient visits. Among the patients who are continuously receiving medical treatment during the survey period, there will be return-visit outpatients who were scheduled to visit on the date of the survey as well as return-visit outpatients who are scheduled to visit on other days. To estimate the total number of return-visit outpatients, the estimated number of return-visit outpatients can be multiplied by the average interval between visits (30 days). This is also multiplied by the adjustment factor (6/7) in order to account for the days without return-visit outpatients, such as Sundays and other holidays.
By summarizing the above survey results, the estimated number of patients classified as having “Injury, poisoning, and certain other consequences of external causes” can be calculated, which are presented in Table 1.
Table 1. Estimated number of inpatients, outpatients, medical consultation rate, and total number of patients with injuries, poisoning, and certain other consequences of external causes
| 0-14 years old | 15-34 years old | 35-64 years old | over 65 years old | total | |
|---|---|---|---|---|---|
| 1.5 | 6.1 | 22.6 | 94.2 | 124.8 | |
| 45.4 | 54.6 | 119.3 | 96.5 | 317.6 | |
| 16,705 | 27,757 | 53,579 | 29,173 | 125,525 | |
2. Annual Incidence of New Injuries
Readers should note that the survey results presented above represent the values from a single day. As the survey aims to provide basic data for the promotion of medical and health services, it is important to be aware of issues such as whether a hospital has sufficient beds or if the physician-patient ratio is appropriate; this explains the need for information on daily patient numbers.
However, this information does not answer the question of how often the average Japanese person is injured in a year. The majority of injury data appearing in this manual provide annual figures, and it is therefore necessary to estimate the annual incidence of new injuries based on the data above. Consequently, there is a need to process these data before they can be used.
To calculate the annual number of inpatients, we can assume that the number of hospitalized patients on the date of the survey is the same throughout the year. Accordingly, the number of patients who are continuously receiving treatment can be calculated by multiplying the number of inpatients on the survey date by 365, and dividing the result by the average length of hospital stay. Fortunately, the survey also records the average length of hospital stay for patients who were discharged in the month preceding the survey date, which can be used in the above calculation. The results of this calculation are presented below in Table 2.
Table 2. Annual incidence of new injuries according to age
| 1.5 | 6.1 | 22.6 | 94.2 | 124.8 | |
| 5.9 | 12.6 | 21.6 | 46.7 | 33.4 | |
| 92.8 | 176.7 | 381.9 | 736.3 | 1387.7 | |
| 16,705 | 27,757 | 53,579 | 29,173 | 125,525 | |
| 0.0056 | 0.0064 | 0.0071 | 0.0252 | 0.0111 |
Elderly persons aged 65 years or older account for more than half of inpatients. In contrast, the calculation of outpatients presents more problems. If we estimate the annual number of outpatients by multiplying the number of outpatients on the survey date by 365 (370,000 outpatients/day × 365 days = 135,050,000), the resulting number would exceed the total population of Japan. This is because the number includes multiple visits by the same patients. How many times, on average, would an outpatient visit a hospital? This number cannot be derived from the published results of the Patient Survey. However, the survey provides data separately for initial-visit outpatients and return-visit outpatients. These data can be used to estimate the average number of outpatient visits using the following formula, which can subsequently be used to calculate the annual number of outpatients.
Average number of outpatient visits = (Estimated number of initial-visit outpatients + Estimated number of return-visit outpatients) ÷ Estimated number of initial-visit outpatients
According to the Patient Survey, outpatients visited medical institutions an average of 5 times for injuries, poisoning, and certain other consequences of external causes. The total annual numbers of outpatients who visit medical institutions according to age are presented below in Table 3.
Table 3. Annual numbers of outpatients who visit medical institutions according to age
| 0-14 years old | 15-34 years old | 35-64 years old | over 65 years old | total | |
|---|---|---|---|---|---|
| 45.4 | 54.6 | 119.3 | 96.5 | 317.6 | |
| 5 | |||||
| 23,185 |
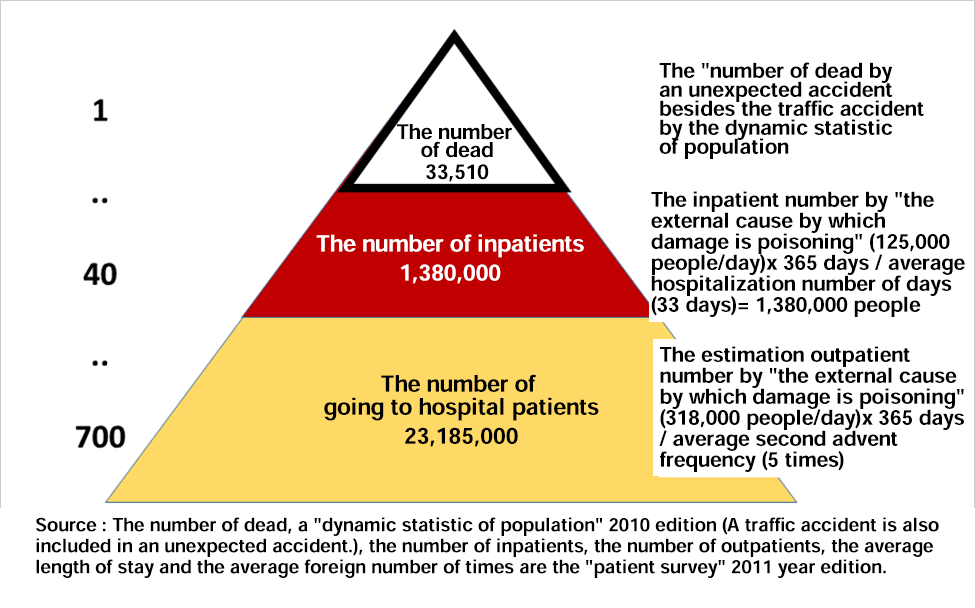
To summarize, there are approximately 1.38 million inpatients and 23.19 million outpatients who are treated annually for injuries, poisoning, and certain other consequences of external causes. We obtain a total of 24.57 million patients annually, which gives a proportion of 0.19 (24.57 million/125.53 million) of Japan’s population. This indicates that one out of every five Japanese people will be treated (either as an inpatient or outpatient) for injuries, poisoning, and certain other consequences of external causes every year.
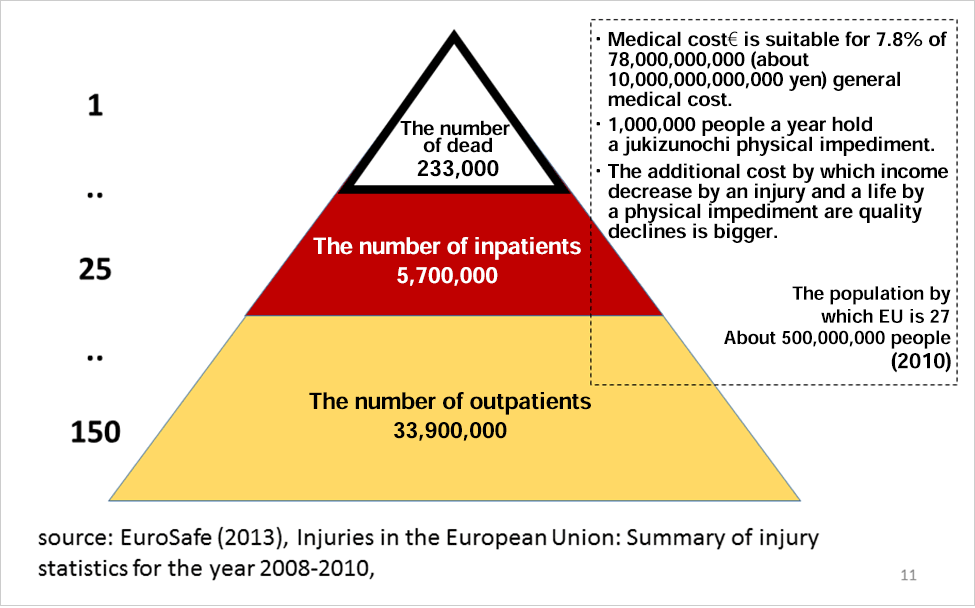
This number is much higher than expected from our actual experience with everyday life. It is possible that the estimated number includes patients who have changed medical institution halfway through treatment, or those that simultaneously receive treatment at multiple institutions. The actual ratio of injury-related fatalities to injury-related outpatients in Europe is estimated to be 1:150; if we apply this to Japan’s data, we get a ratio of 1:700. Due to a current lack of data to clarify the actual conditions, we are unable to extrapolate these figures any further.
Supposing that these figures are accurate, the probability that no one in a family of four would be treated at a hospital for an injury in a year can be calculated as (1-0.19)4, or approximately 43%. Conversely, the probability that someone in that family of four would be treated at a hospital for an injury in a year can be calculated as 1-(1-0.19)4, or approximately 57%
However, this probability is highly dependent on the age structure of the family. As shown in Tables 2 and 3, elderly persons are more likely to be hospitalized or treated as outpatients. Therefore, the inclusion of elderly persons raises the probability of being injured and requiring treatment.
In Table 4, we present the results of the probabilities of receiving treatment as inpatients or outpatients for members of various typical family units.
Table 4. Probability of receiving treatment as inpatients or outpatients for members of typical family units
3. Number of Fatalities Due to Injuries
On the other hand, just how many fatalities are there due to injuries, poisoning, and certain other consequences of external causes? We can use population vital statistics to address this question. In the survey results from 2011, the number of accidental deaths was found to be 33,510.
4. Injury Pyramid
Based on the above data, we can construct the following injury pyramid of Japan.

Reference: Injury Pyramid of the European Union

