Product Life WG
1. Product Survival Rate, Product Life, and Residual Risk of Recall
As a form of data utilization technology, this project is examining the methods concerning the risk evaluation of unfinished recalls that both the government and business entities struggle with. We presented our findings on the estimation method of product survival rates (an important key to risk assessment of recalled products) at the Society for Risk Analysis Annual Meeting in 2014 in the US. Subsequent results were presented at the World Congress on Risk 2015, which was held in Singapore.
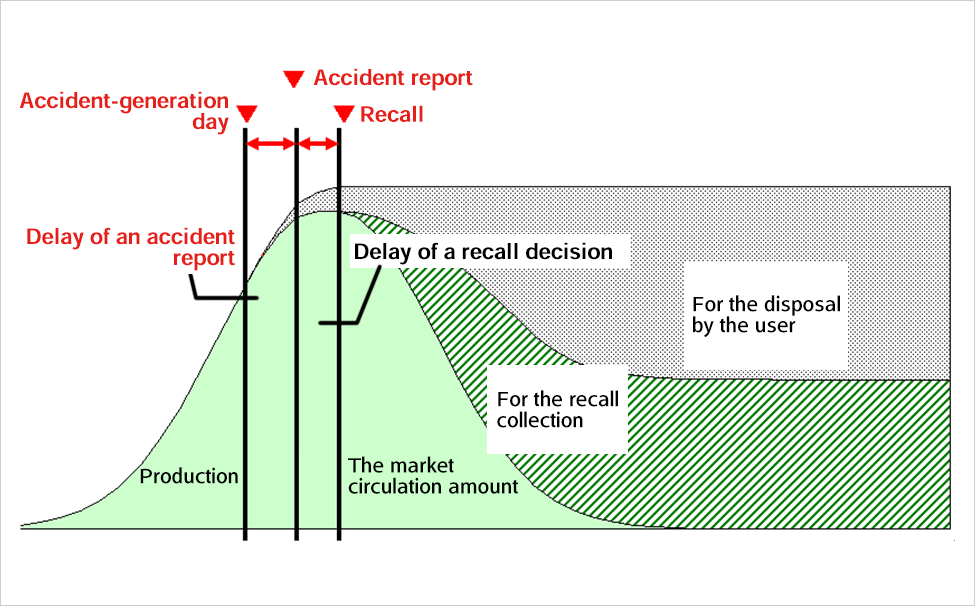
If we are able to obtain the product survival curve r(t), the risk assessment of unfinished recall products can be performed using a relatively simple formula. In actual practice, the survival curves of individual products can be accumulated using this method, and widely provided as public data. This facilitates the simple risk assessment of unfinished recalled products, and it may be possible to conduct these analyses using an evidence base.
With regard to this theme, the research and development efforts conducted this year were further developed after becoming acquainted with new stakeholders; based on survival rate estimates, the research challenges expanded to include estimates of product life. These new stakeholders in question were Mr. Toshinori Watanabe and Mr. Toshiro Kikuchi, who are part of the Product Life Working Group (WG), which is an organization formed in 2011 comprising volunteer experts with an interest in industrial product safety issues (the chairperson is Dr. Masao Mukaidono, Professor Emeritus of Meiji University). This study’s principal investigator and colleagues had published a paper entitled Characterization of Product Accident Rate based on Product Accident Database and Consumer Confidence Survey (The Journal of Reliability Engineering Association of Japan), which was the product of a research topic supported by a Grant-in-Aid for Scientific Research and, in essence, the preliminary study for this current research. This paper drew the attention of Mr. Watanabe, who then contacted the principal investigator. Following several sessions of exchanging ideas, we were able to delve deeper into this research theme.
Over a span of approximately three years, this WG had (centering on 20 engineers in manufacturing companies working on product safety) conducted research on product life and how products break down. However, the lack of information on the number of surviving units in each product formed a bottleneck, and research activities were halted due to the inability to resolve this issue. During that period, our research team published the above paper, and the principal investigator was contacted; this effectively cleared the path that enabled us to estimate the number of surviving units in individual products. (Refer to Table 16)
Activities of the Product Life WG and exchange activities with this research project
| 2007 | ||
| 2011 | ||
| 2012 | ||
| 2013 | ||
| 2014 | ||
| 2015 | ||
| 2016 |
A new development is that with the use of our proposed method for estimating the number of surviving units, we were able to calculate the time-related changes in product accident rates. This facilitates the estimation of product life through implementation of the Weibull distribution analysis. While the provision of feedback on risk-related information to the producers and designers remains an important task of this project, the establishment of a methodology that approaches product life data from a macro perspective would provide an effective tool for designers.
Figure 14 illustrates the Weibull distribution developed through the meetings that have been conducted thus far. The Weibull distribution, which is a probability distribution function proposed by Waloddi Weibull in 1939 to statistically explain the strength of an object, is used to describe the degradation phenomenon over time and the object’s lifespan. The Weibull distribution is a probability distribution generally expressed by the following formula:
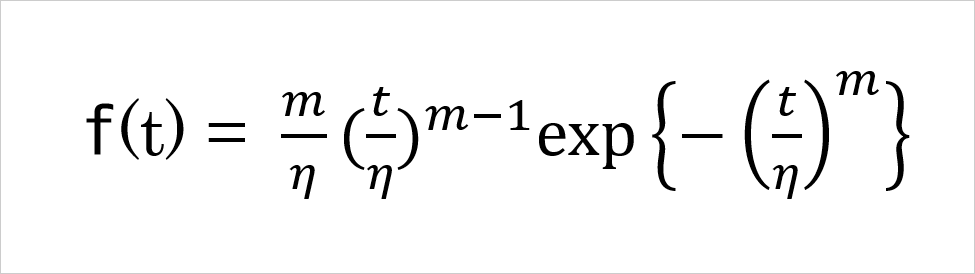
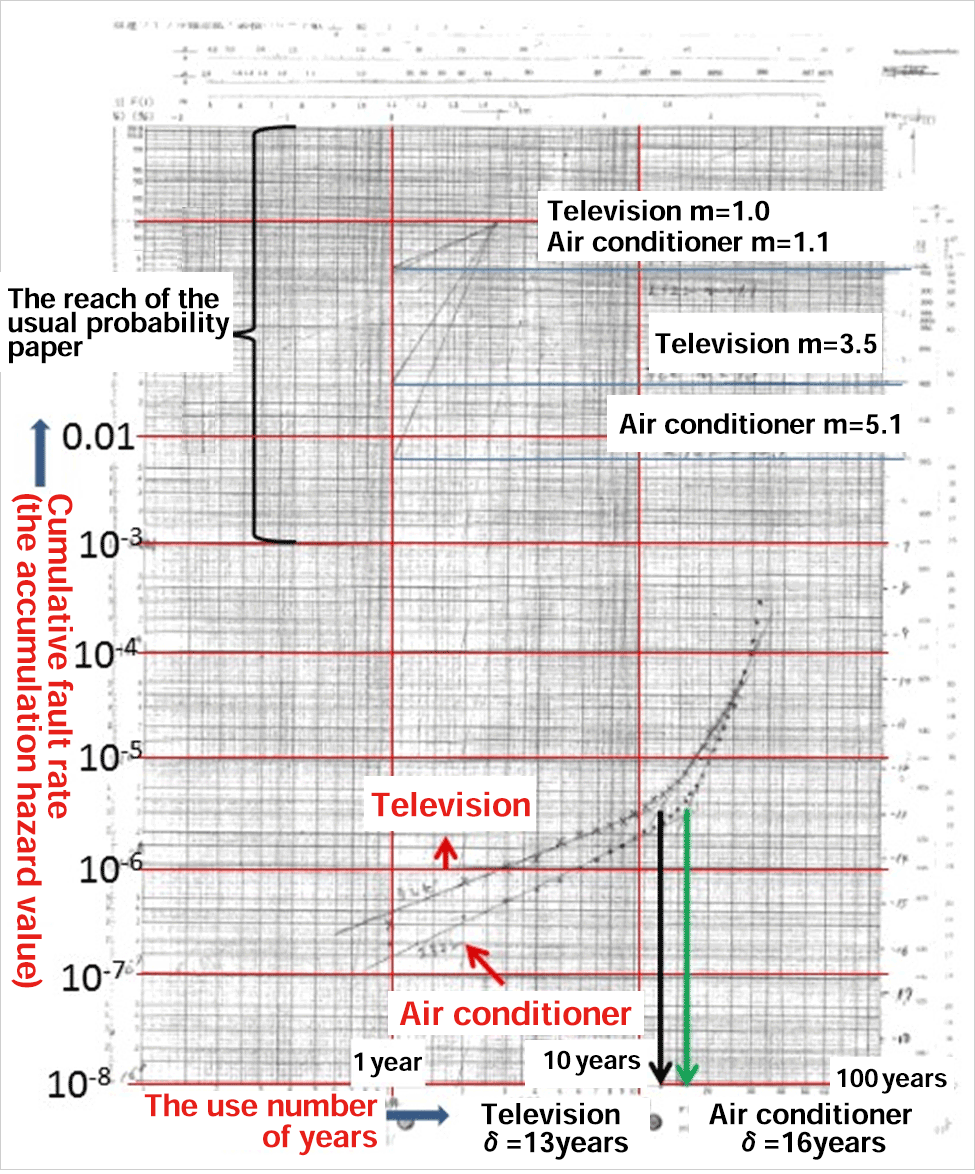
Figure. The Weibull curve for the accident rates of televisions and air-conditioners
Here, m refers to the Weibull coefficient or the geometric parameter, and η refers to the scale parameter. The Weibull distribution changes substantially with changes to the value of m. For example, the Weibull distribution is an exponential distribution when m = 1, but becomes a Rayleigh distribution when m = 2. In general, the failure phenomenon also changes with time, and can be classified into the three categories of initial-stage failure, accidental failure, and wear-out failure. When applying the Weibull distribution to the accident rate curve, it is able to accommodate m < 1 for initial-stage failures, m = 1 for accidental failures, and m > 1 for wear-out failures. The δ when accidental failures transition to wear-out failures is, essentially, product life. It would be of great interest to examine the product life (in years) of products that are actually in the market.
Figure 14 shows the results of actual television and air-conditioner accident rates that were fitted to the Weibull distribution using the method proposed in this study. This figure shows that δ is approximately 11 years for television and 13 years for air-conditioners. In the future, we wish to further improve upon this result and couple it to practical estimates of product life. A report in the previous year has shown that it is possible to use a simple formula in calculating the risks that recalled products remain in the market. The National Institute of Technology and Evaluation (NITE) product recall database indicates that there are approximately 1,800 incomplete recalls at present in Japan. The identification of the product with the highest risk from among all these recalled products is a major problem faced not only by the businesses involved, but also by the authorities. A key issue is that there are no reliable data on the quantity of recalled products that remain in the hands of consumers. Our proposed estimation method has provided insight on product life, which facilitates the acquisition of highly reliable evidence by the manufacturers and authorities.